
Core Web Vitals Explained
We talk a lot about optimizing user experience in digital products. Fast load times, responsive interactions, stable layouts - but how do you actually measure whether a page feels fast? And how do you know when your users are getting frustrated - before they leave?
Core Web Vitals are a set of metrics that quantify real-world user experience on the web. Three metrics covering loading speed, responsiveness, and visual stability. They matter for UX first - but they also feed into Google's search ranking, which makes them doubly relevant for any site that depends on organic traffic.
There are three official Core Web Vitals: LCP, INP, and CLS. I'm adding TTFB to this article because it's not officially a Core Web Vital, but it directly affects all of them - and it's the first thing I look at when diagnosing performance issues.
Here's a quick overview, then each metric explained individually.
| Metric | Full Name | What it measures | Threshold |
|---|---|---|---|
| LCP | Largest Contentful Paint | How quickly the main content appears on screen | ≤ 2.5s |
| INP | Interaction to Next Paint | How fast your UI reacts after a user interaction | ≤ 200ms |
| CLS | Cumulative Layout Shift | How stable the layout feels while loading | ≤ 0.1 |
| TTFB | Time to First Byte | How quickly the server starts responding | ≤ 800ms |
Google measures these at the 75th percentile of page loads, segmented across mobile and desktop. A page "passes" Core Web Vitals when 75% of visits meet the "good" threshold for all three official metrics.
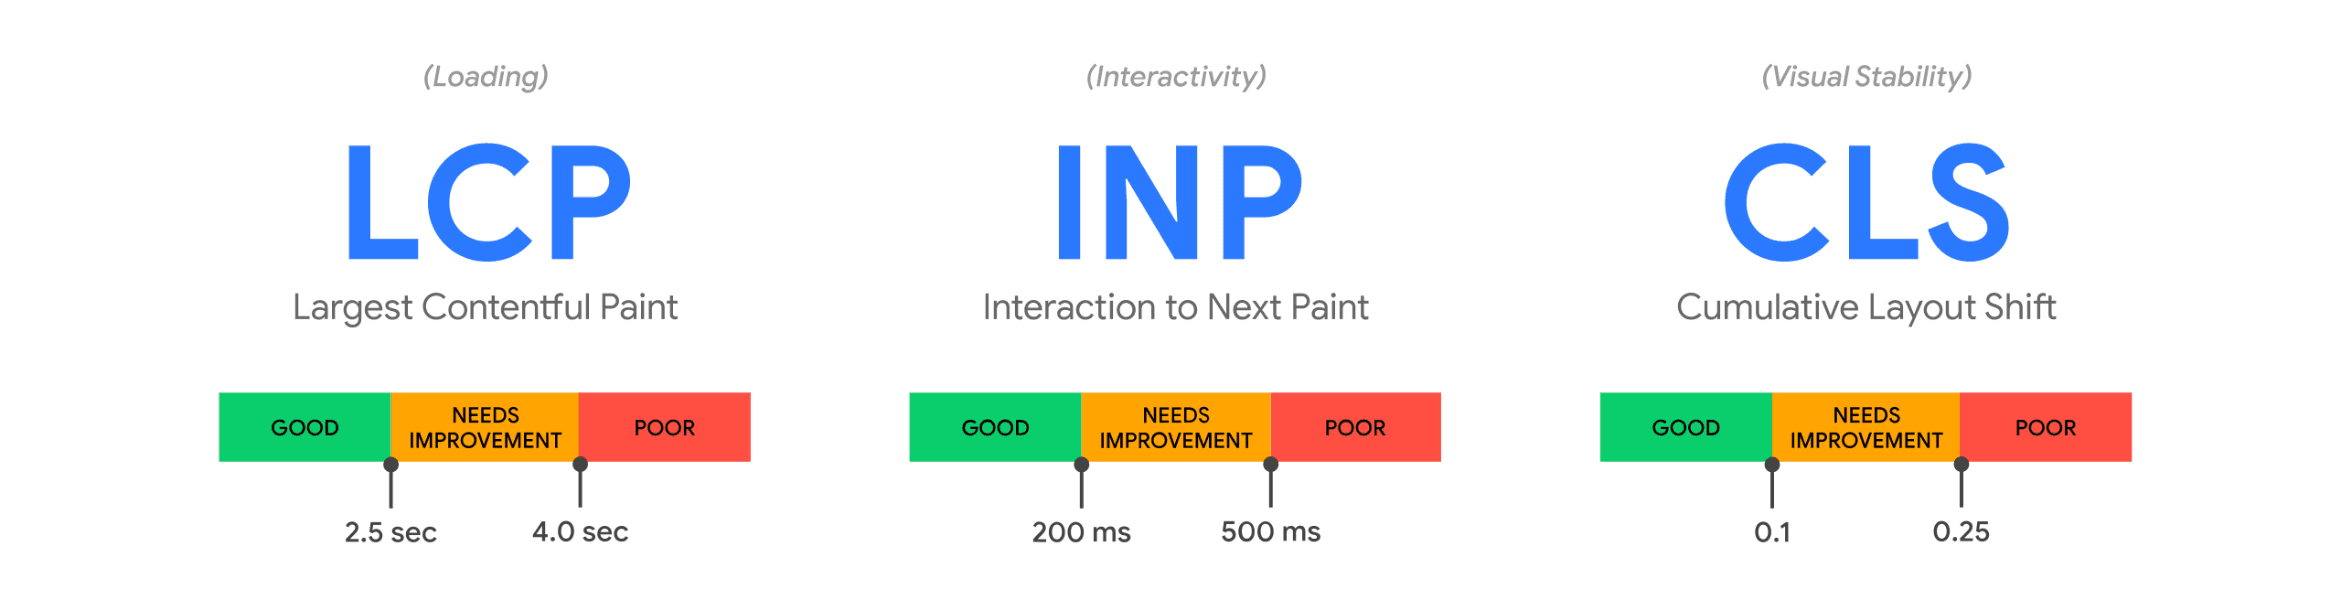
LCP - Largest Contentful Paint
LCP measures the time until the largest visible element in the viewport finishes rendering. Usually that's a hero image, a video poster, or a large text block - whatever takes up the most visual space above the fold. It's the moment the page looks loaded.
Of all the metrics, this is the one users feel most directly. A blank screen or a skeleton layout doesn't count - LCP fires when the actual content is visible.
Common causes of poor LCP: slow server response time (which is where TTFB comes in), render-blocking CSS or JavaScript, large unoptimized images, and client-side rendering that delays the initial paint. Web fonts that block text rendering can also push LCP out.
Good LCP: 2.5 seconds or less.
INP - Interaction to Next Paint
INP measures the delay between a user interaction - a click, a tap, a keypress - and the next visual update on screen. It captures the worst interaction during the entire page visit (technically the 98th percentile if there are enough interactions).
INP replaced First Input Delay (FID) as a Core Web Vital in March 2024. The difference matters: FID only measured the first interaction. A page could score perfectly on FID and still feel sluggish on every subsequent click. INP catches that because it looks at all interactions, not just the first one.
The most common cause of poor INP is heavy JavaScript execution blocking the main thread. Long tasks, expensive re-renders, synchronous layout calculations - anything that keeps the browser busy when the user tries to interact.
Good INP: 200 milliseconds or less.
CLS - Cumulative Layout Shift
Ever scrolled through a page reading an article and everything starts jumping around because yet another advertisement loaded? Or tried to tap a button on mobile and hit the wrong thing because a banner pushed the content down at the last second?
That content jumping around is what CLS measures. Specifically, it tracks the total amount of unexpected layout shifts during the page's lifecycle. Shifts triggered by user interaction (like expanding an accordion after a click) don't count - only shifts that happen without the user doing anything.
Common causes: images or videos without explicit width and height attributes, dynamically injected content (ads, cookie consent banners, promotional bars), and web fonts that cause text to reflow when they swap in (known as FOIT and FOUT - Flash of Invisible Text and Flash of Unstyled Text).
CLS is unitless. It's a score, not a time measurement, which makes the threshold less intuitive than the other metrics. Just remember: anything above 0.1 needs attention.
Good CLS: 0.1 or less.
TTFB - Time to First Byte
TTFB is not an official Core Web Vital. It's a diagnostic metric - useful for understanding why the other metrics are bad, especially LCP.
It measures the time from the browser's request to the first byte of the server response. That includes DNS lookup, TLS handshake, and server processing time. Everything the server needs to do before it can start sending content to the client.
In my experience, TTFB is where I start when diagnosing performance issues. If TTFB is bad, optimizing images or reducing JavaScript won't help - the bottleneck is upstream. A 2-second TTFB means your LCP physically cannot be under 2 seconds, no matter how optimized your frontend is.
Common causes of poor TTFB: slow server-side rendering, missing or misconfigured caching, geographic distance between the user and the origin server (no CDN), slow database queries, and server-to-client waterfalls where the server itself waits on upstream services before it can respond.
Good TTFB: 800 milliseconds or less.
Measuring Core Web Vitals
The quickest way to check your current scores is PageSpeed Insights - paste a URL, get results based on real Chrome user data. That's a useful one-time snapshot, but it doesn't replace regular monitoring. Core Web Vitals fluctuate with traffic patterns, new deployments, and content changes. You want to catch regressions early.
I wrote a separate article on how to measure Core Web Vitals in Next.js.